

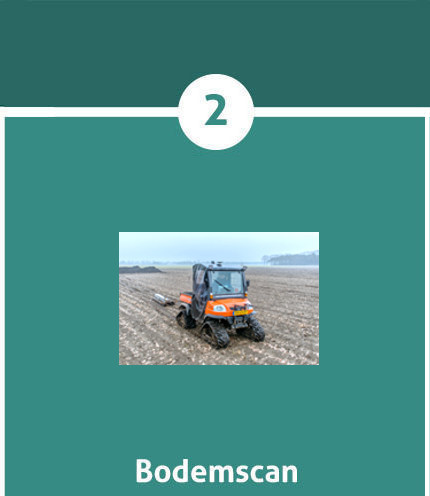
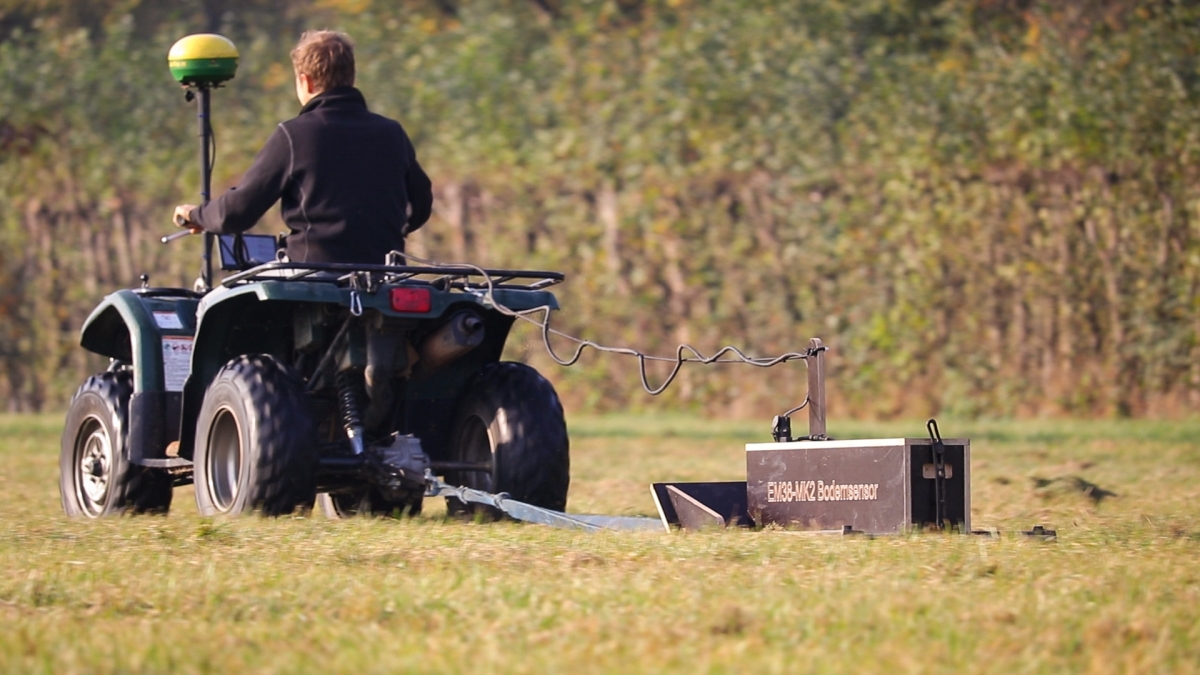
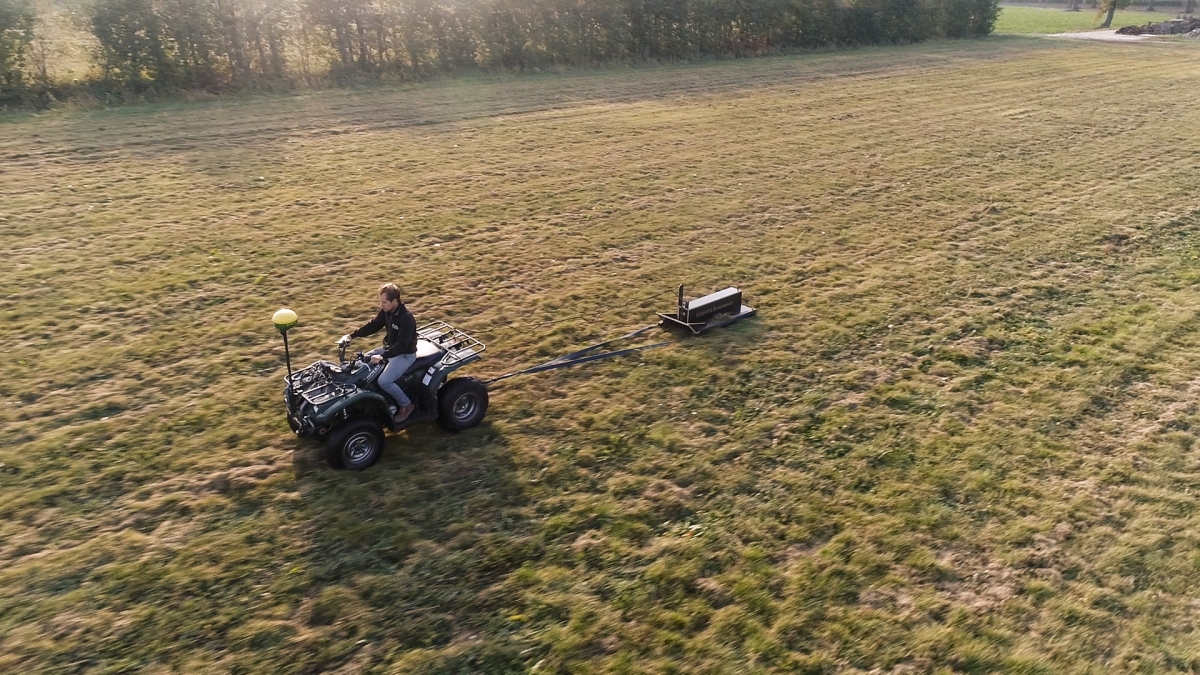
Step 2: Soil scanning
The soil consists of mineral soil particles (45%), organic matter (5%), air (26%) and water (24%) (Delden van, 2015). The shape and size of the mineral soil particles can differ, so that the soil on a plot is not the same everywhere. In addition, the organic matter, pH and nutrient content can vary within a plot. Differences in the soil, such as dry and wet spots on a plot, can be shown via a soil scan. The places at which a soil sample must be taken are also determined on the basis of the soil scan. A soil scan is performed at Van den Borne potatoes with a soil conductivity sensor such as an EM38-MK2 sensor or a Dualem 21s sensor. The difference between the different soil conductivity sensors is the depths in which they measure. The table below shows the sensors and depths at which they measure. The soil scans at our company are performed by Soilmasters. This is a collaboration between Fleuren tech, Soil services and Van den Borne potatoes.

The soil scan is used to gain insight into the composition of the soil. Different values are measured in the soil via electromagnetic radiation due to the electrical conductivity and magnetic sensitivity. These values can relate to the nutrients in the soil, the organic matter content, the structure of the top and / or subsoil, texture, profile structure and / or moisture of the soil. The data is collected in Cloudfarm as described in step 1. This makes it possible to process measured data into cultivation measures such as spreading fertilizer and spraying in such a way that the quantities can be dosed depending on the working width. Below are some images of soil conductivity maps. The red color indicates a high conductivity, yellow a moderate conductivity and blue a poor conductivity in the soil. In addition, a video has been shown about soil scanning with the dualem21s.
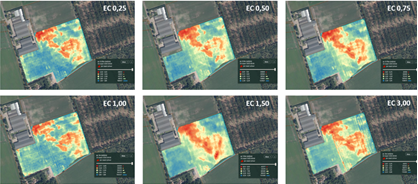
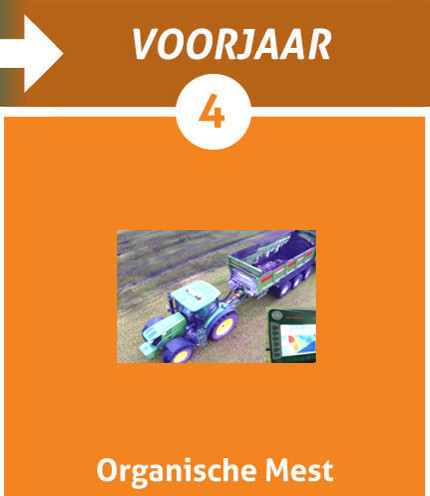
The information from a soil scan is used to determine the parcel layout for, among other things, variable irrigation and harvesting pieces separately. This map is also used to determine representative locations in a plot for crop measurements. In addition, the soil conductivity map is used to place a irrigation sensor on the field with which the optimum moment of irrigation can be determined. We place this sensor in a place on the plot where the conductivity is average. Furthermore, the information can help to explain place-specific differences in yield and to support various cultivation activities. In the video below you can see how we use the soil sensor to apply variable compost.
In the video below you can see how we use the soil sensor to apply variable compost.


Social media
Bezoekers online: 18